The Data Story: Food Safety Data Management and Utilization
Oktober 13, 2025

If your food safety team is collecting samples, running tests, and tracking sanitation performance, you’re generating data. But that data only becomes useful for building a story about your facility’s food safety performance when you incorporate it into a well-designed management system. Not only can a sound system help food and beverage processors understand food safety risks and production issues while decreasing the likelihood of future mistakes, but it can also improve productivity, aid in preventive maintenance and capital investment decisions, enhance business opportunities, and support access to global markets. However, implementing a robust system requires time, effort, and expertise—and often depends on management support. These initial challenges can be significant, but the long-term benefits of a mature data management and utilization system that provides meaningful insights make the investment worthwhile.
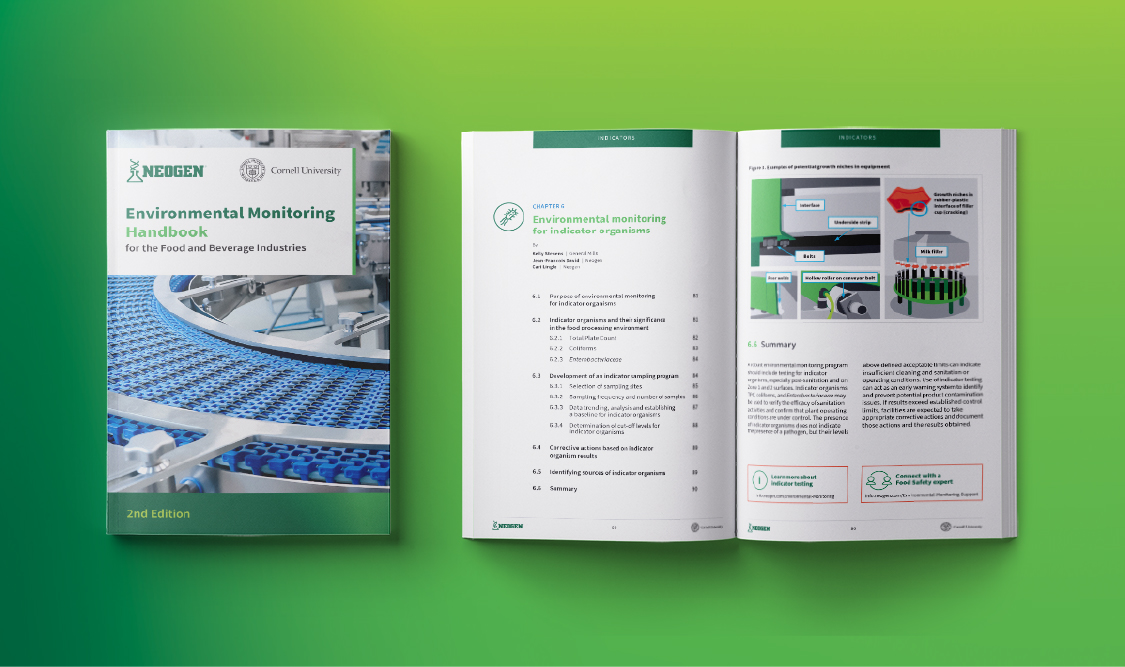
This article introduces core principles for building a successful data management and utilization system, explaining how implementing them can help your team leverage environmental monitoring data as a powerful decision-making tool. For a complete guide, be sure to download the Neogen Environmental Monitoring Handbook for the Food and Beverage Industries (2nd Edition, 2025).
Building the Foundation: Structure and Components of a Data Program
To maximize your environmental monitoring data, begin by clearly defining the data and metadata your team needs to collect. For example, if your team is swabbing surfaces to quantify Enterobacteriaceae levels, the number of colony-forming units is the data, and the location, zone, time, and equipment are the metadata.
After defining your data and metadata, standardize the terminology used to describe them in your system. Consistent language across your system reduces confusion and supports data consistency. For example, your team should not use the terms “drain,” “floor drain,” and “drain basket” interchangeably to describe the same item.
Anatomization of data fields in your system is also important. This means organizing data and metadata into small, discrete units or variables. For example, instead of entering multiple details into a single open-response field (e.g., “conveyor on line 2 collected on 2 May at 3 pm”), this approach breaks that entry into structured fields for each detail: equipment, line, date, and time. This makes downstream analysis easier to search, sort, and interpret.
Facilities may differ in the variables they choose to collect, but all should be intentional. Without this level of detail, your data may lack the clarity needed to support meaningful analysis. With a strong foundation in place, your team can now focus on advancing the system for greater impact.
Advancing the System: Data Governance and Maturity
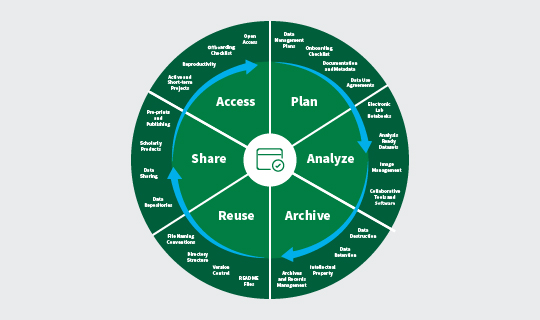
Figure 1. Academic data lifecycle chart
Your data should clearly and effectively communicate your facility’s food safety story at the right time. That means moving beyond data storage into a more mature, database-driven management system that organizes data collection and provides real-time functionality.
In a mature data management system, data governance (Figure 1) ensures that information is stored securely, remains accurate, and is accessible when needed. For example, instead of storing large amounts of data in spreadsheets or binders, mature systems deliver specific information to the right user at the right time. This functionality enables stakeholders to analyze and reuse the data as needed to obtain further insights and gain a much greater return on investment (ROI).
A more mature system may aggregate data into a software program that allows your team to generate graphs and reports with minimal effort. This shift away from binders and spreadsheets is significant because it supports continuous improvement through more precise tracking and more effective communication using real-time data.
Extracting Insights: Data Analysis Approaches
Once your data and system are in place, the next step is determining how to analyze the information and what types of downstream insights your team wants to gain. Insights may include:
Summary Statistics: Simple calculations that track and trend results over time. Teams can review them on a regular schedule, such as during monthly or quarterly meetings.
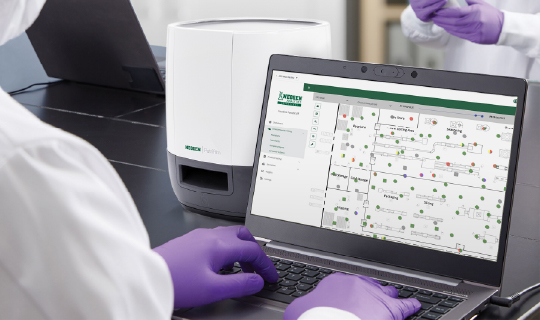
Visualizations: Floor plans, charts, tables, or graphs that help your team spot trends and patterns at a glance. The more robust your data, the more detailed these visualizations can become, allowing your team to analyze results based on a variety of features such as zone, site, shift, or time frame.
Complex Statistical Models: Predictive tools that forecast spoilage risks or other future outcomes based on historical data. Large facilities and academic institutions typically utilize these models.
Turning Data Into Action: Communicating Your Data Story
Once your team has gathered, organized, and analyzed the data, the final step is using that insight to tell your data story and drive action. Data management and analysis programs, no matter how capable, can’t interpret results or define your next move. That’s why it’s important to invest in food safety and quality staff who have strong interpretive and communication skills. Instead of overwhelming management with an excessive amount of figures that obscure the main story the data is conveying, this trained staff should identify the key learnings and present them in a clear, meaningful way. Successful communication of your data story connects analysis results to actionable steps that support operational improvements and align with your food safety objectives.
Starting Smart: Small Steps Toward a Stronger Data Management System
As your team works to strengthen its data management program, it’s important to recognize that every facility begins from a different starting point. Some may already have components of a structured program in place, while others are building from the ground up. External experts can also be valuable resources to help assess your current program and guide you on the next steps.
However, no matter your starting point, the best path forward is to focus on small, clear steps that your team can implement consistently. Improvements in how you collect, manage, analyze, and communicate data will build over time. While this may require effort upfront, the long-term benefits make the investment worthwhile for both your food safety program and your business.
To explore these core principles further, download the Neogen Environmental Monitoring Handbook for the Food and Beverage Industries (2nd Edition, 2025). The handbook offers additional guidance on defining data and metadata, strategies for overcoming common barriers, and examples of charts and graphs to help you visualize what your team can present with a mature data management system.
Kategorie: Lebensmittelsicherheit, Essen & Getränke, Umweltüberwachung